

The bears had their shot last week, as Treasury yields soared—and at a bad time, too, as the third week of September is historically one of the worst weeks of the year. Unfortunately for the bears (and fortunately for the rest of us), they couldn’t just make headway. Yields may have moved to new highs, but stocks again shrugged off the worry and moved higher, with the tech-heavy Nasdaq hitting new highs and the S&P 500 less than 1% away from new highs.
In our 2026 Outlook: Ride the Wave, shared way back in January, we said we believed this would be a year of inflationary growth, with an economy that looks strong once you include inflation, robust earnings and profit margins, AI capex spending providing a boost, yields staying higher than most expected, and a labor market that keeps improving even as inflation stays sticky. Heading into the final quarter of the year, that call has generally been on target. Economic growth remains near trend, the unemployment rate has fallen despite modest job gains, and massive AI investment has helped fuel a historically large upside earnings surprise—which is what really matters to stocks. Speaking of the labor market, this Friday brings September’s nonfarm payrolls report, and we expect another decent print.
September Hasn’t Been So Bad, and Welcome to Historically the Best Month of a Midterm Year
With three trading days to go, the S&P 500 is up close to 1% in the dreaded month of September. We heard all month how bad this month was going to be, but we pushed back against that narrative, and September has bucked the bearish sentiment, much like August did.
We will be the first to admit you should never invest solely based on the calendar. Still, it’s important to understand history, and the good news for investors is that some of the best times of the year to invest historically are near.
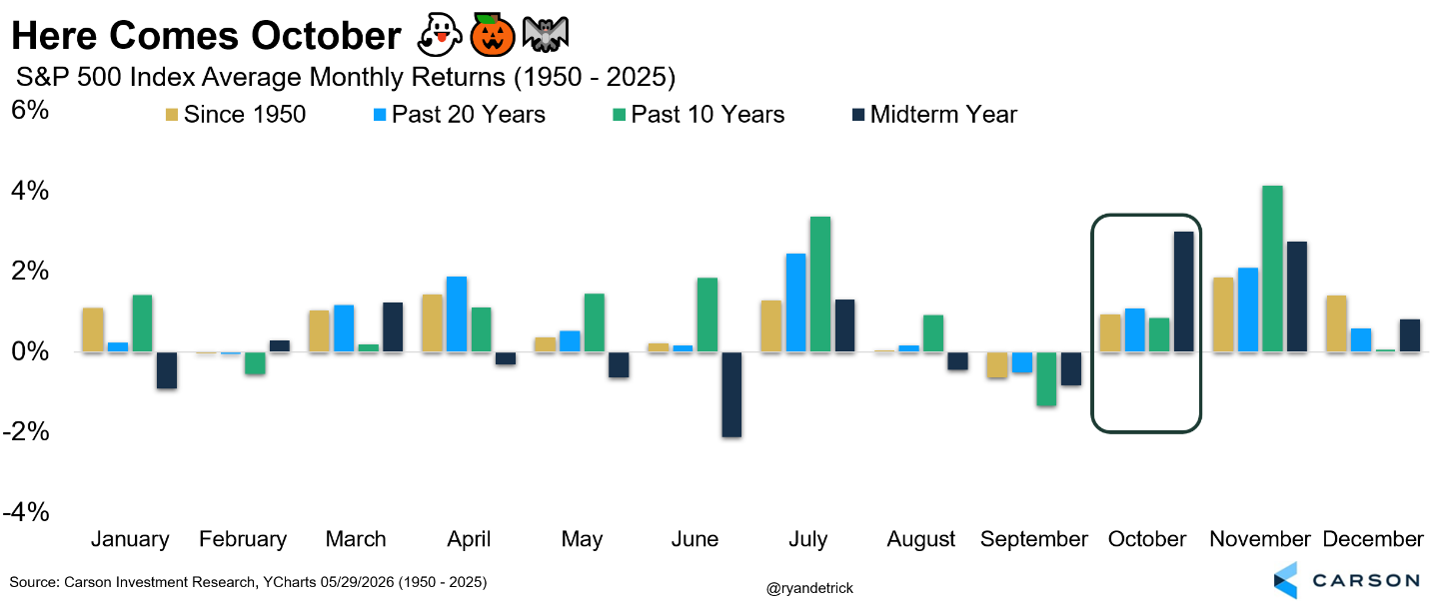
Yes, October is known for spectacular crashes—1929, 1932, 1937, 1987, and 2008 were all down double digits. Here’s the thing, though: October might be very bad when it’s bad, but overall, it ranks as the seventh-best month since 1950, the fifth-best over the past 20 years, and the eighth-best over the past 10 years. Not the best, but solid, and not so spooky overall.
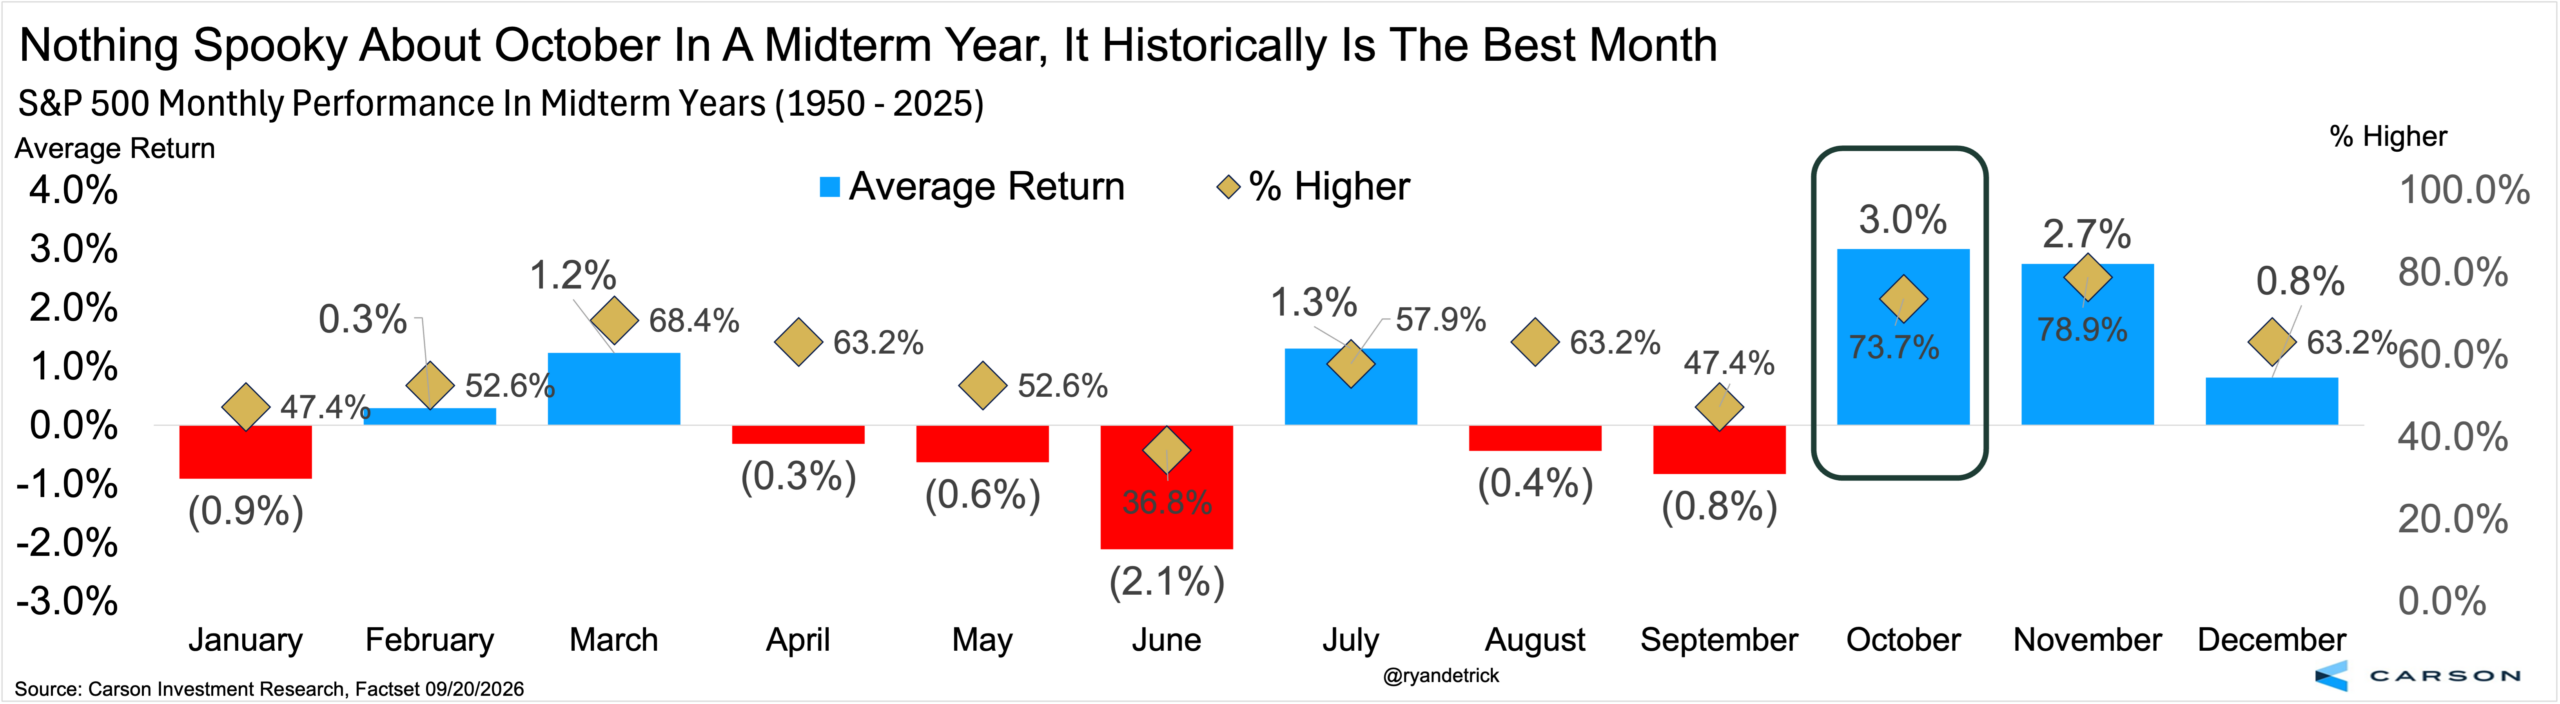
Where this month gets really interesting is in midterm election years. In a midterm year, October has been the best month of the year, up 3.0% on average and higher nearly 74% of the time. The second-best month is right behind it: November, up 2.7% on average and higher nearly 80% of the time. But there’s something for everyone here. In President Trump’s first midterm year, back in 2018, the S&P 500 fell nearly 7% in October, the only negative October in a midterm year over the past eight cycles.
We don’t suggest blindly investing based on this pattern, but we are expecting a strong fourth quarter to close out a nice year for investors, and this does little to change our view.
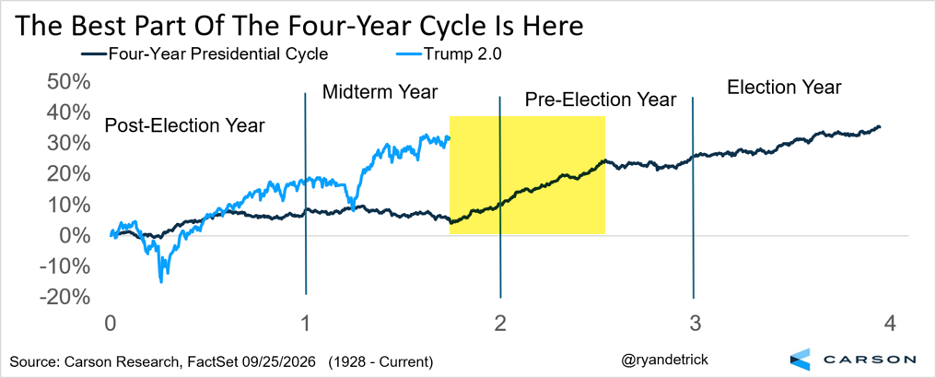
History Shows the Best Part of the Four-Year Presidential Cycle Is Now
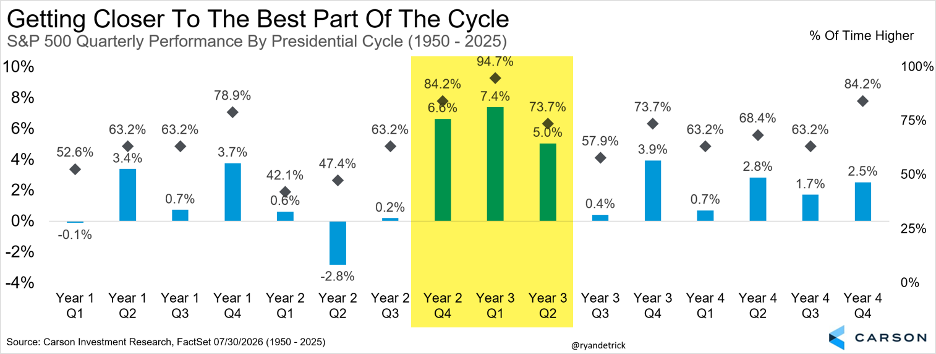
Taking this a step further, the fourth quarter of a midterm year and the first two quarters of a pre-election year (the next three quarters) are the three best quarters out of the entire four-year presidential cycle. Stocks have done well under President Trump so far this midterm year relative to other midterm years, so some of the gains could be pre-loaded here. That’s always a possibility, but overall, we remain optimistic this bull market is alive and well, and more gains are likely the rest of this year and into the next.
Of course, the second quarter of a midterm year has historically been the worst quarter on average, and all it did this year was soar a record-breaking 15%. We use this as a guide, not gospel, as our friend Sam Stovall, Chief Investment Strategist at CFRA, likes to say. As we noted in late March, when many others were cutting their targets and preparing for the worst, we said a rally was likely—which fortunately played out well.
The Data Says the Consumer Is Clearly in Good Shape
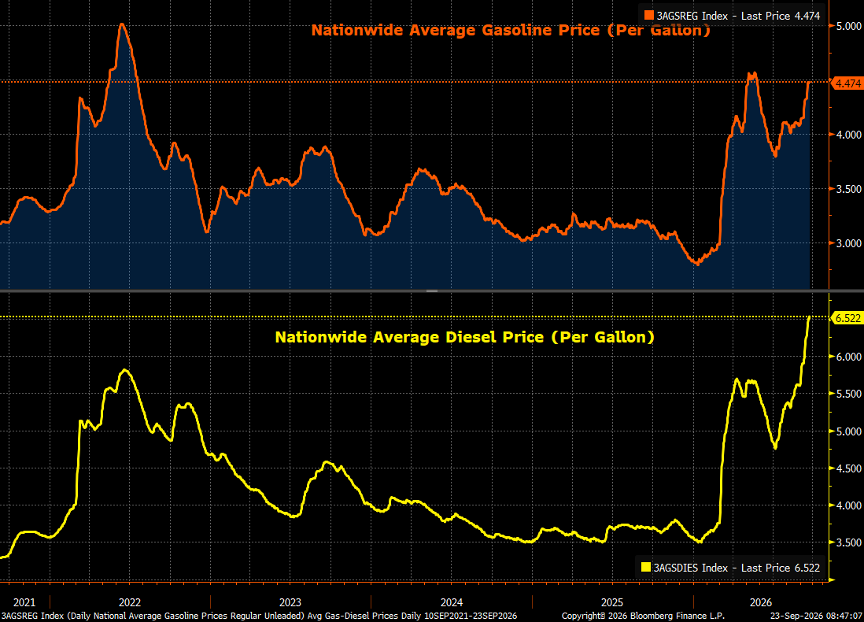
This headline might seem hard to square with gas prices near $4.50 a gallon and diesel at a record $6.53 (nationwide averages), while inflation is running hot across the board, from electronics to pet care to lawn care. Surely consumers are struggling. But there are two ways higher gas prices can play out: Consumers pay up for gas and cut back everywhere else, or consumers pay up for gas and keep buying everything else at the same pace, inflation or not.
This has implications for Fed policy and long-term rates. In the first scenario, rate hikes slow the economy further—higher rates can’t produce more oil, but they can lower demand everywhere else, and longer-term yields would likely fall. In the second, hiking may simply be “meeting the moment” of stronger nominal demand, keeping long-term yields elevated. If the Fed eventually has to slam on the brakes, growth and long-term yields would fall then. But that’s not where they are now, even with some additional rate hikes.
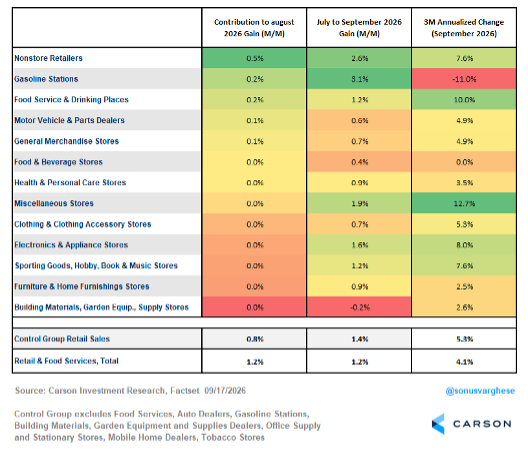
It’s clear to us that we’re in the second dynamic now, especially after August retail sales showed spending running hot. Sales rose 1.2% for the month, but monthly data are volatile, so we look at the last three months: Sales increased at a 4.1% annualized pace between June and August, while core retail sales (excluding gas stations and autos) rose at a stronger 5.3% pace. Notably, online spending (“nonstore retailers”) rose 7.6% annualized, and restaurant sales (“food services and drinking places”) rose 10%.
Restaurant sales are among the most discretionary line items—the first thing households cut when they’re genuinely stretched. They haven’t. These are nominal figures, so rising prices are doing some of the lifting, but even after adjusting for inflation, restaurant sales are up more than 6%. Households are willing to pay higher prices and increase spending volume, which is telling.
The last jobs report also pointed to a solid and improving labor market, and weekly jobless claims underline this. On a non-seasonally adjusted basis, initial claims are 22% below the comparable week a year ago and at their lowest since September 2022. Claims are also 12% below the 2018-19 benchmark for this week, consistent with a healthy labor market, and layoffs remain historically low. The insured unemployment rate—continuing jobless claims as a percent of the workforce—is at 1.0%, matching the 2018-19 average and below the 1.2% of a year ago.
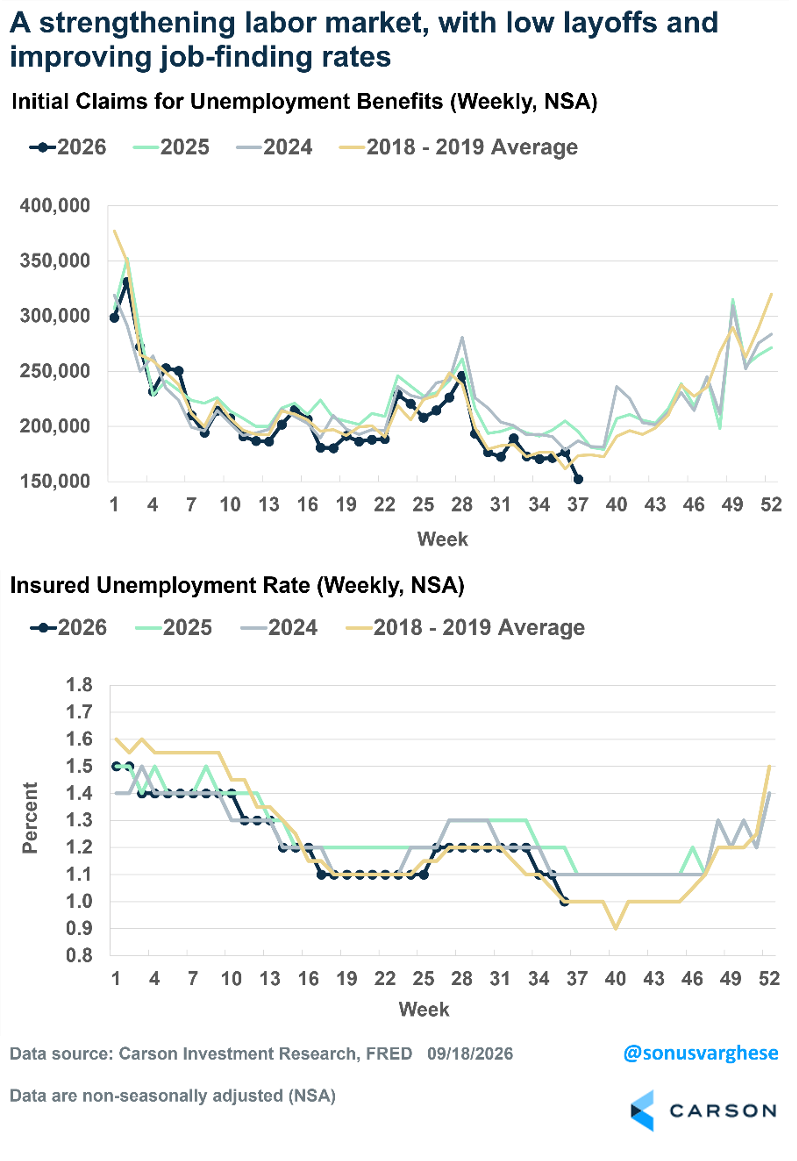
Nothing here points to labor-market deterioration, and lower continuing claims point to a better environment for the unemployed. Put that next to retail sales, and the message is the same: The consumer is in a strong place, despite inflation.
Household Balance Sheets Are Strong, Bolstered by Stocks
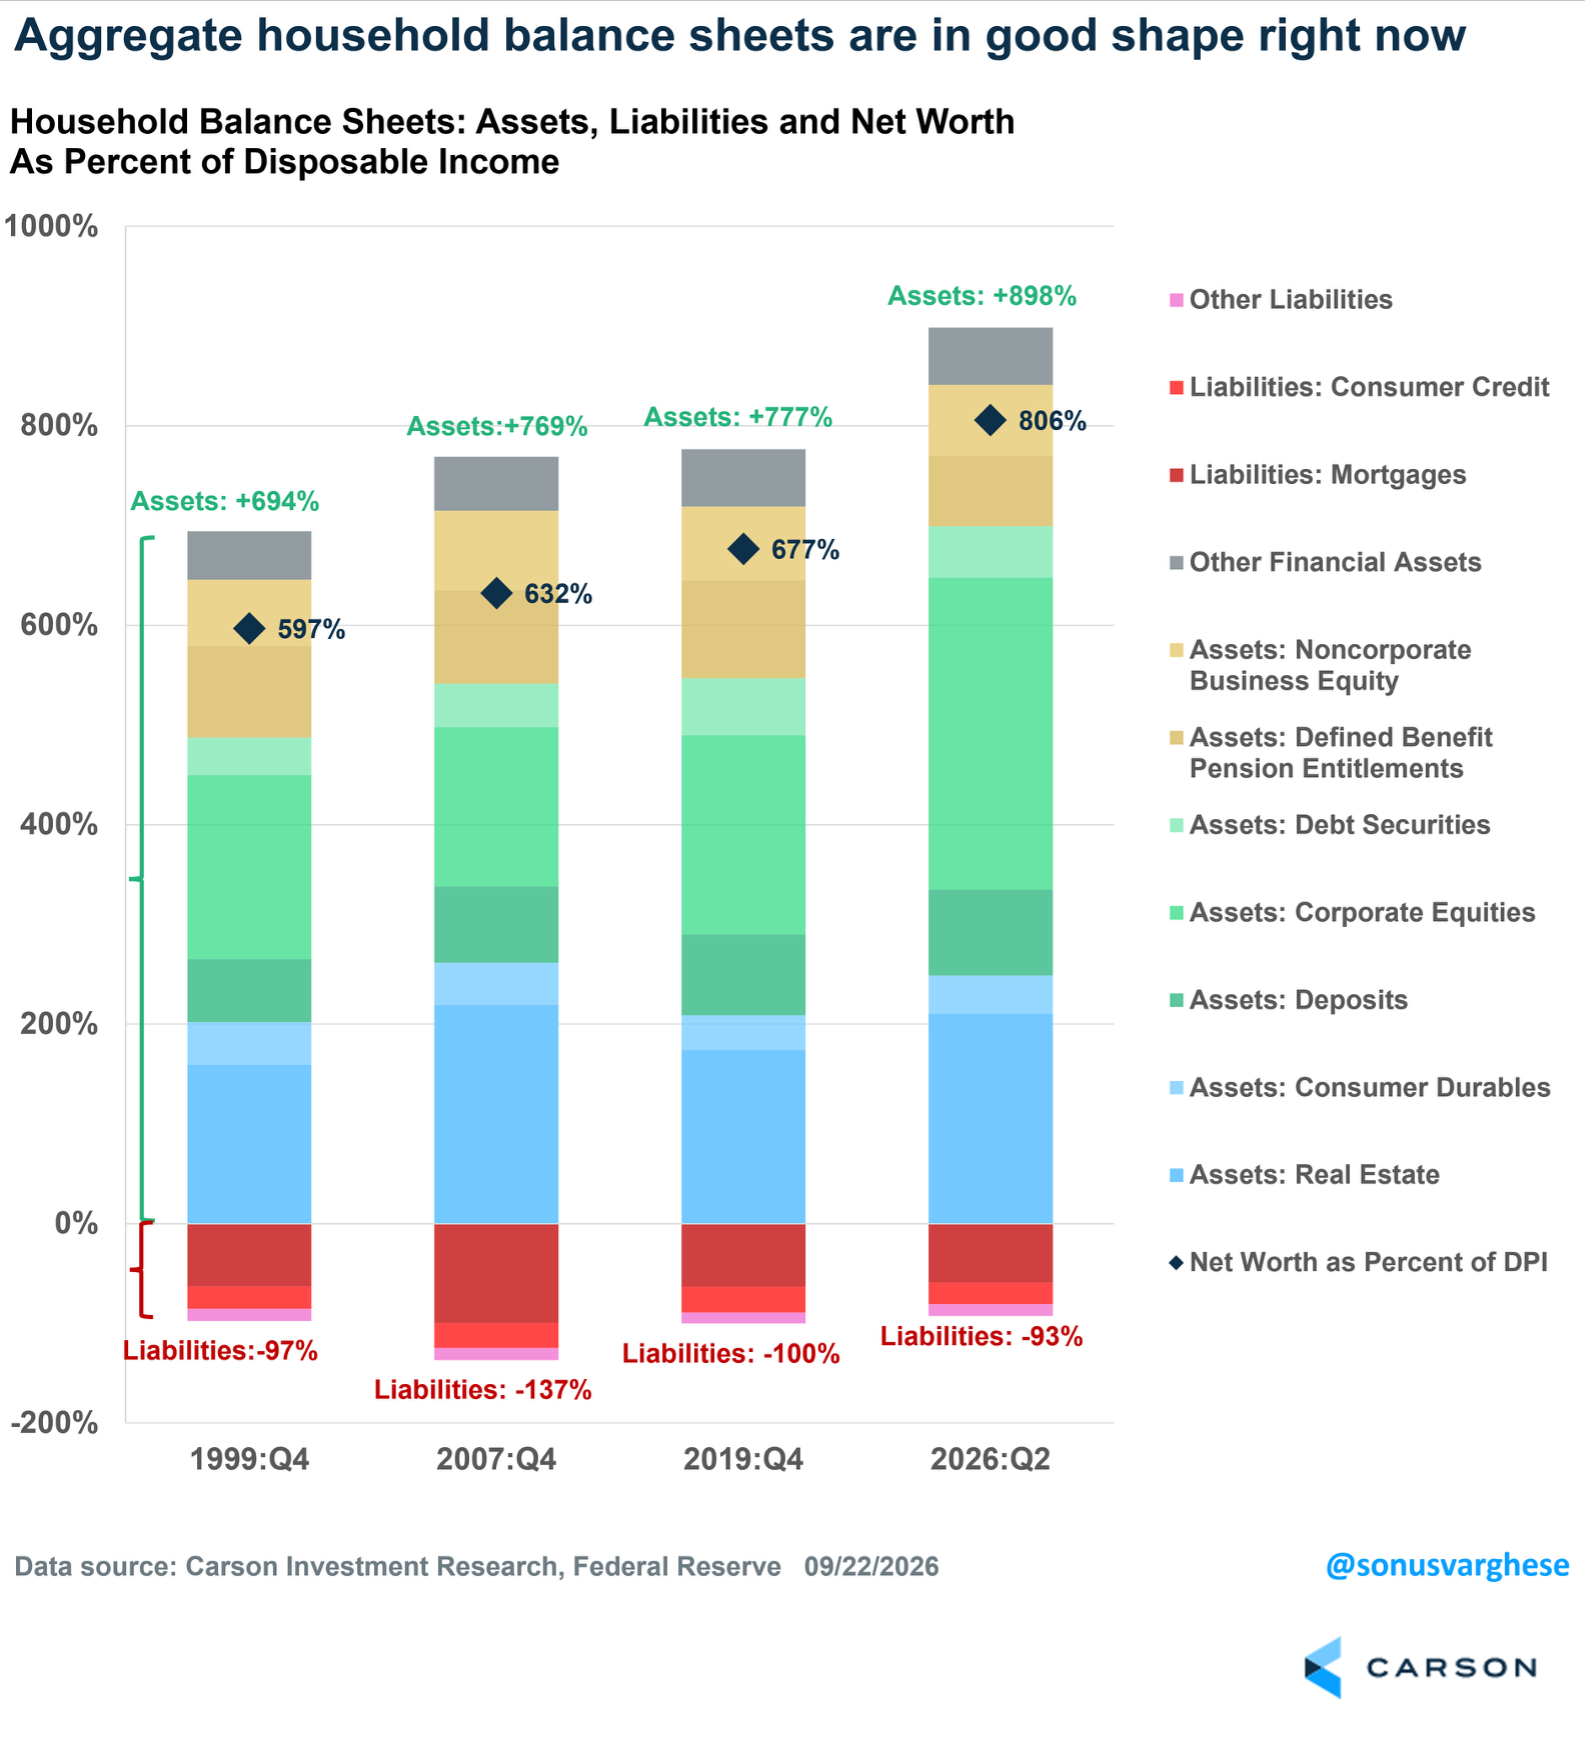
Here’s a chart we’ve been sharing for a few years, showing consumer balance sheets in very good shape in aggregate. As of the second quarter of 2026, net worth was 806% of disposable income, up from 759% in the first quarter and well above prior expansion peaks: 677% in 2019, 632% in 2007, and 597% in 1999.
The improvement over the last six and a half years comes down to three factors.
First, liabilities are 93% of disposable income, versus 100% at the end of 2019 and 137% just before the financial crisis. Households were far more levered in 2007, which made rising unemployment and falling home prices much more damaging—that’s not the case today. Liabilities relative to income show debt-service capacity; relative to assets, they show shock absorption. On that basis, household leverage fell to 10.3% in the second quarter from 10.8% in the first. For perspective, it was 12.9% in the fourth quarter of 2019, 17.8% in the fourth quarter of 2007, and 14.0% in the fourth quarter of 1999. The peak was 20.2% in the first quarter of 2009, and the last lower reading was in the first quarter of 1962. Households have essentially unwound the leveraging cycle that ran from the mid-1960s through the financial crisis.
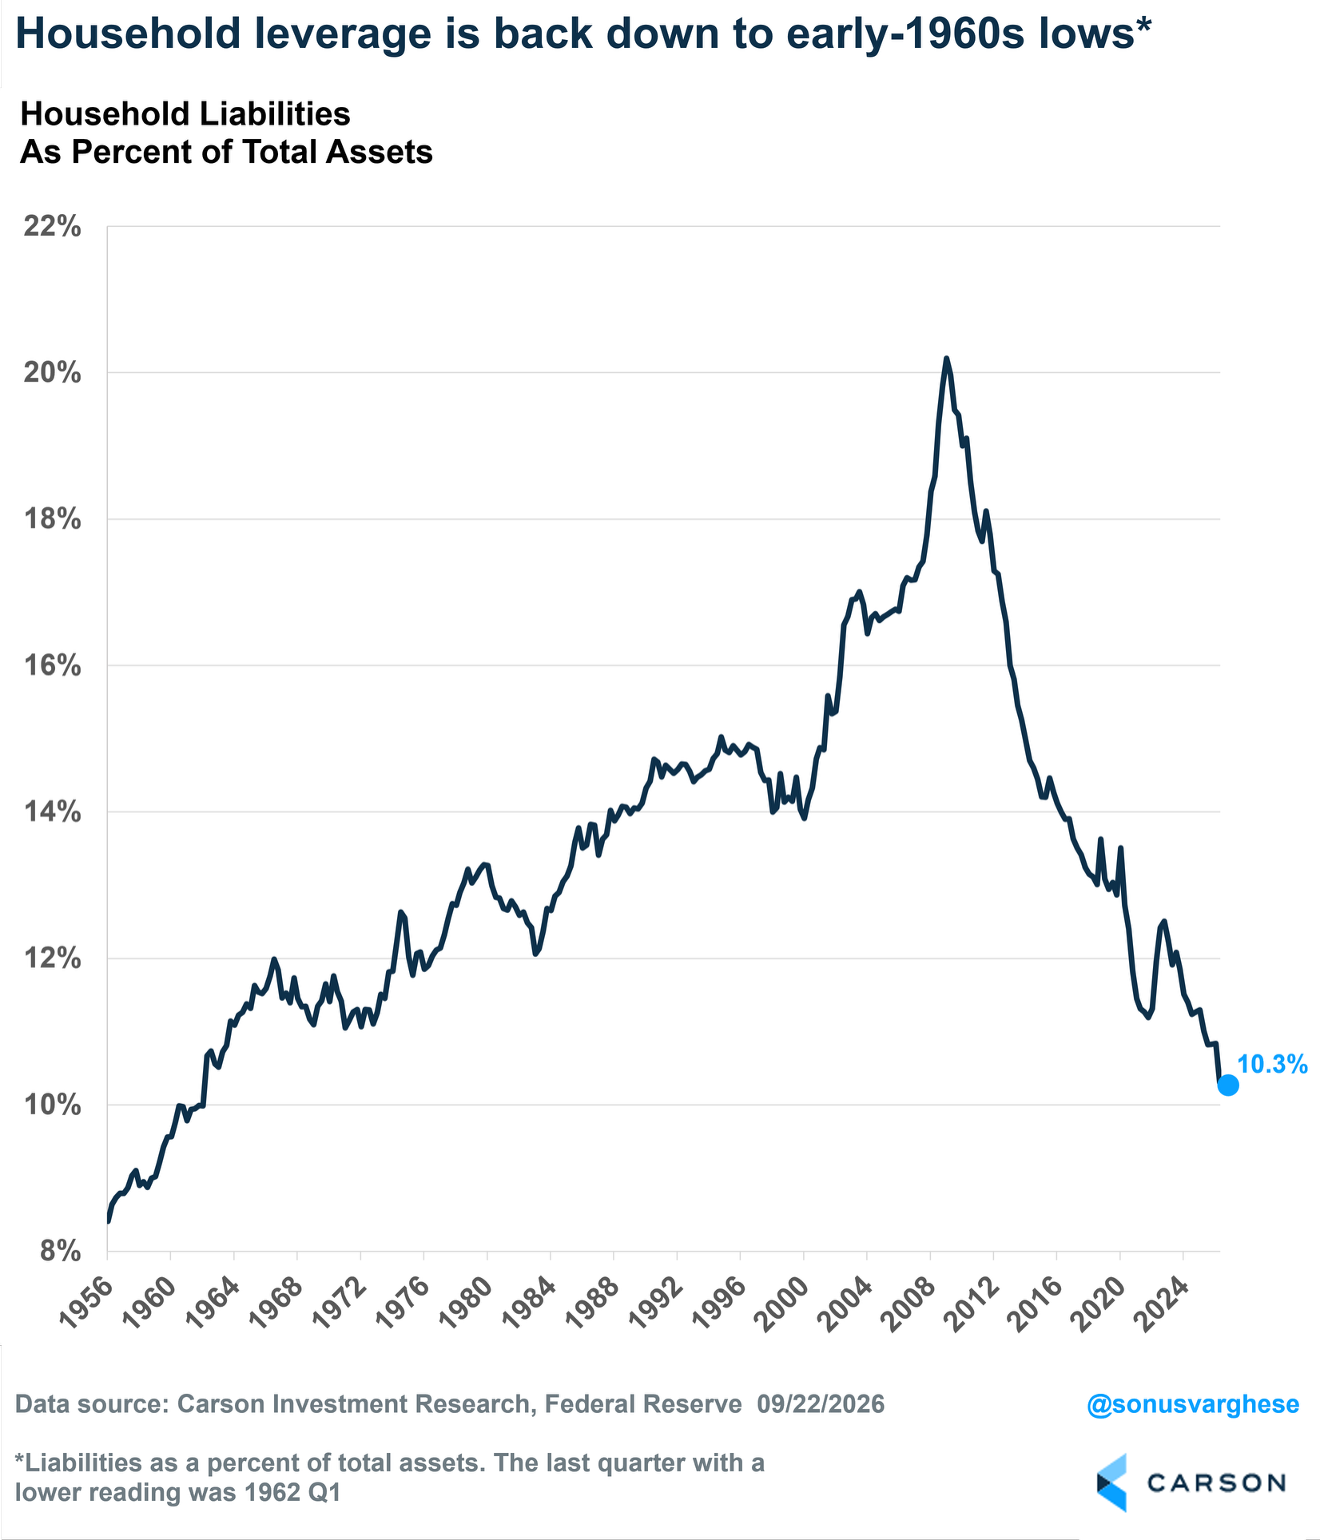
One caution: This ratio improves when asset prices rise, not just when debt falls. A big enough drop in stocks or home prices would push it higher mechanically, without any new debt—which gets to the other two reasons balance sheets have improved.
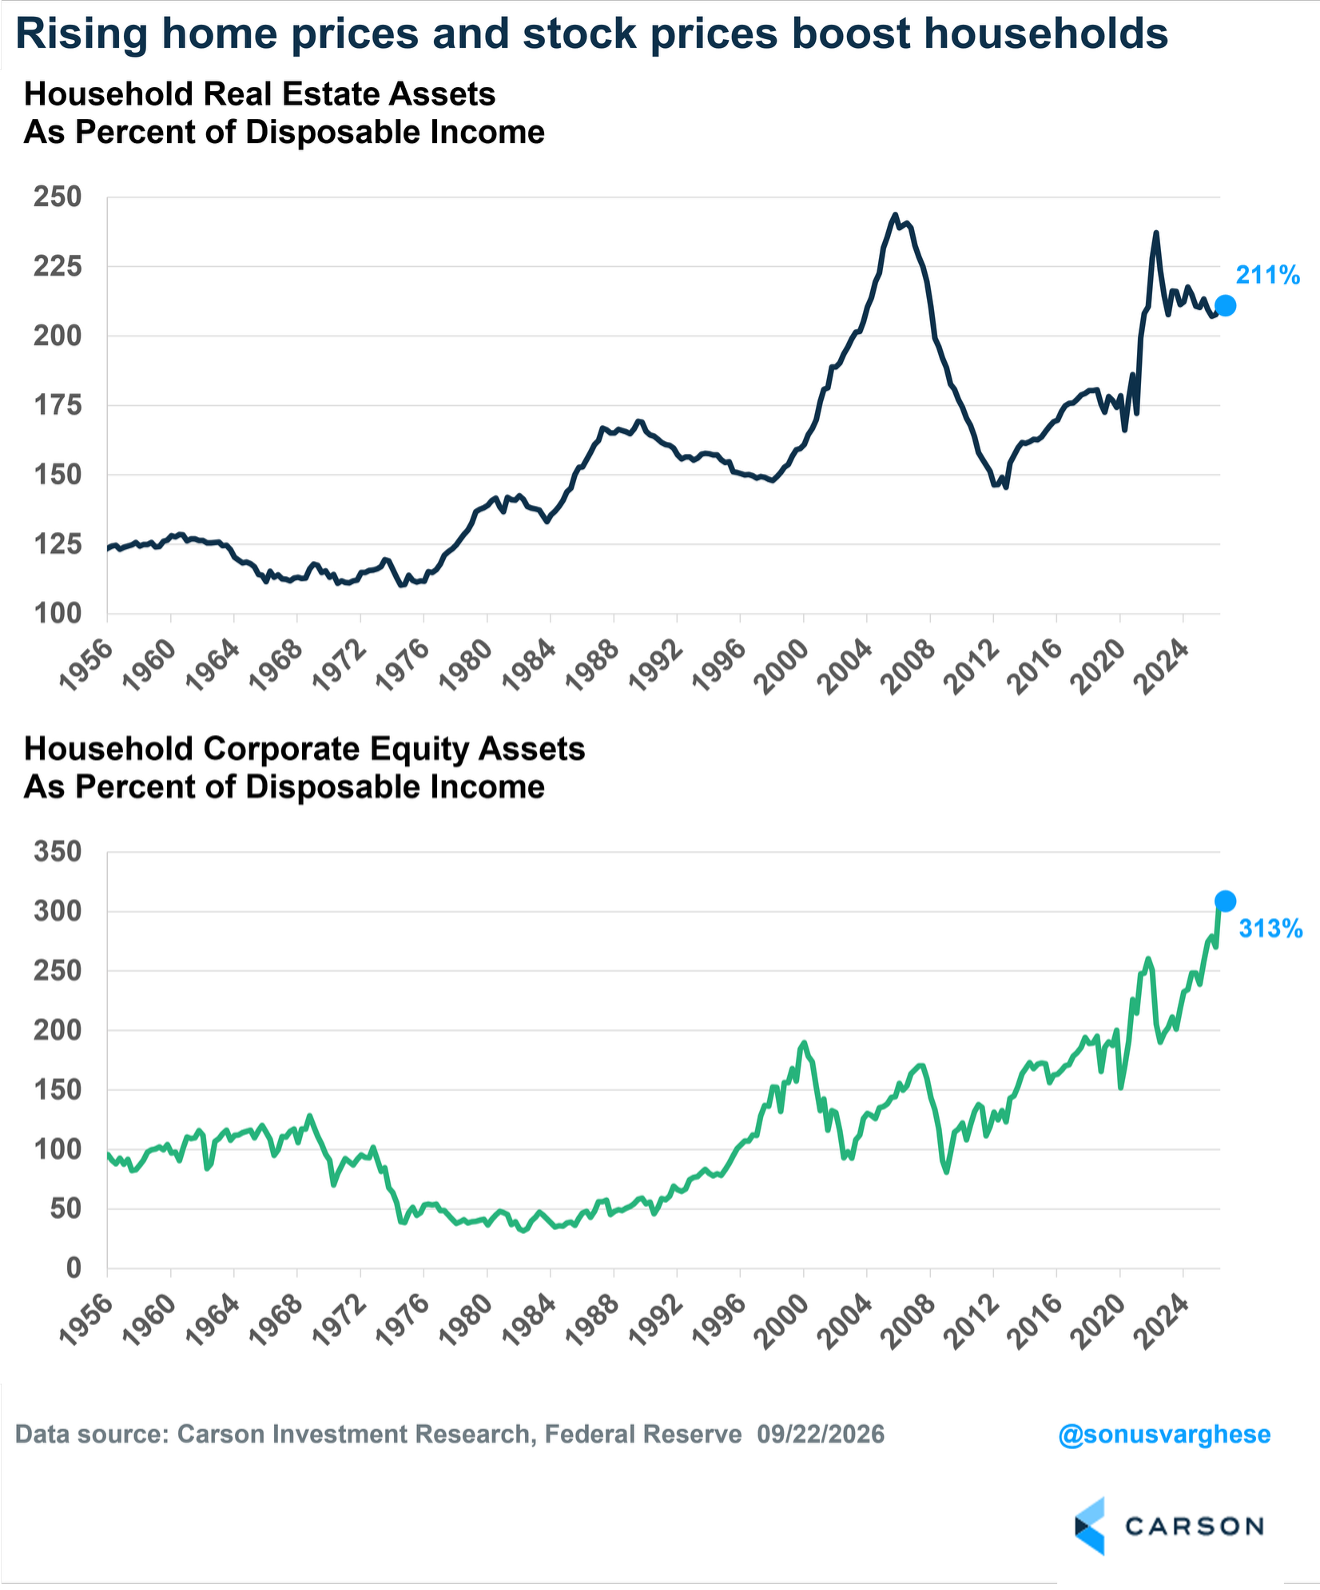
Second, real estate assets are 211% of disposable income, up from 174% at the end of 2019 and near 219% in 2007. Real estate peaked at 244% in the fourth quarter of 2005 and hit 237% again in the second quarter of 2022, drifting lower since as incomes rose while home prices flatlined.
Third, equity holdings are 313% of disposable income, up from 200% at the end of 2019 and 160% in 2007. Even at the dot-com peak, they were just 190% in the first quarter of 2000.
What Could Upset the Apple Cart? A Bear Market
A sustained bear market would be extremely damaging to household balance sheets. Rising stock prices have been the biggest driver of net worth over the last five years. Equities are now 38.9% of net worth, a record going back to the start of the data in 1952, up from 29.6% at the end of 2019, 25.2% at the end of 2007, and 30.9% at the end of 1999.
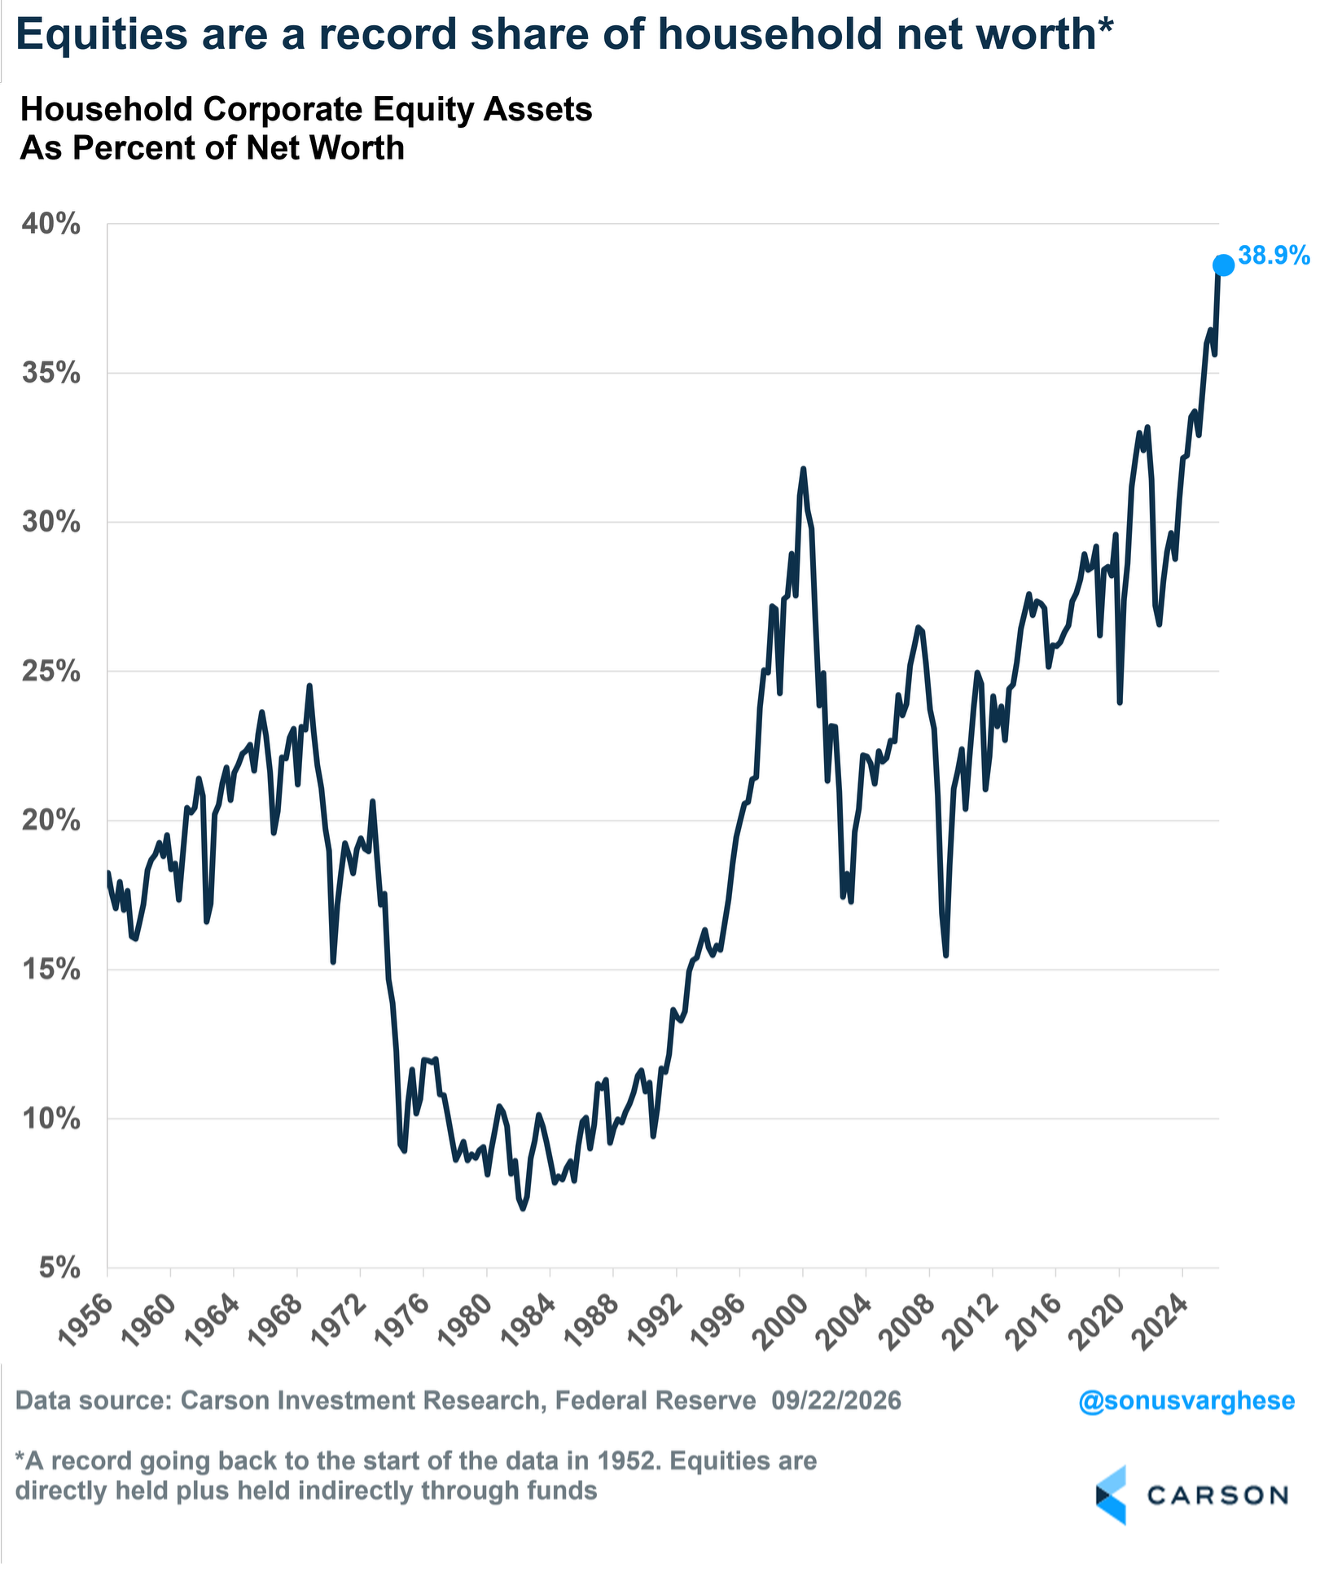
That leaves household balance sheets unusually exposed to a volatile asset. We got a demonstration of this two quarters ago: Stocks pulled back in the first quarter and net worth fell about 8 percentage points of disposable income, even without any added leverage. The second quarter ran the mechanism in reverse, with net worth gaining 47 points as stocks hit new highs.
This can feed on itself. A sustained decline could set off a vicious cycle:
- Bear market →
- Weaker household balance sheets (including from falling home prices) →
- Lower spending →
- Lower revenues and hiring →
- Rising unemployment →
- Falling aggregate income →
- Lower spending →
- Lower profit growth, if not an outright decline
Once the process starts, it can feed on itself, so an external catalyst is needed to break the loop. That’s not our base case. We can still get volatility, but for stocks to materially damage household balance sheets, we likely need a sustained bear market lasting much longer than we’ve seen recently.
Big picture: Household leverage is the best it’s been in 60 years, and net worth is setting records again, driven entirely by the asset side. Households are being marked to market rather than borrowing their way into trouble. That means the thing to watch from here is the S&P 500, not household debt. The economy may be more tied to the stock market—and vice versa—than ever. For now, and possibly several years, that’s OK.
S&P 500 — A capitalization-weighted index of 500 stocks designed to measure performance of the broad domestic economy through changes in the aggregate market value of 500 stocks representing all major industries.
The NASDAQ 100 Index is a stock index of the 100 largest companies by market capitalization traded on NASDAQ Stock Market. The NASDAQ 100 Index includes publicly traded companies from most sectors in the global economy, the major exception being financial services.
The views stated in this letter are not necessarily the opinion of Cetera Wealth Services LLC and should not be construed directly or indirectly as an offer to buy or sell any securities mentioned herein. Investors cannot invest directly in indexes. The performance of any index is not indicative of the performance of any investment and does not take into account the effects of inflation and the fees and expenses associated with investing.
A diversified portfolio does not assure a profit or protect against loss in a declining market.
All investing involves risk, including the possible loss of principal. There is no assurance that any investment strategy will be successful. This information is from sources believed to be reliable, but Cetera Wealth Services, LLC cannot guarantee or represent that it is accurate or complete.
Sam Stovall is not affiliated with CWM, LLC, nor Cetera Wealth Services LLC.
9148584.1-0926-C
